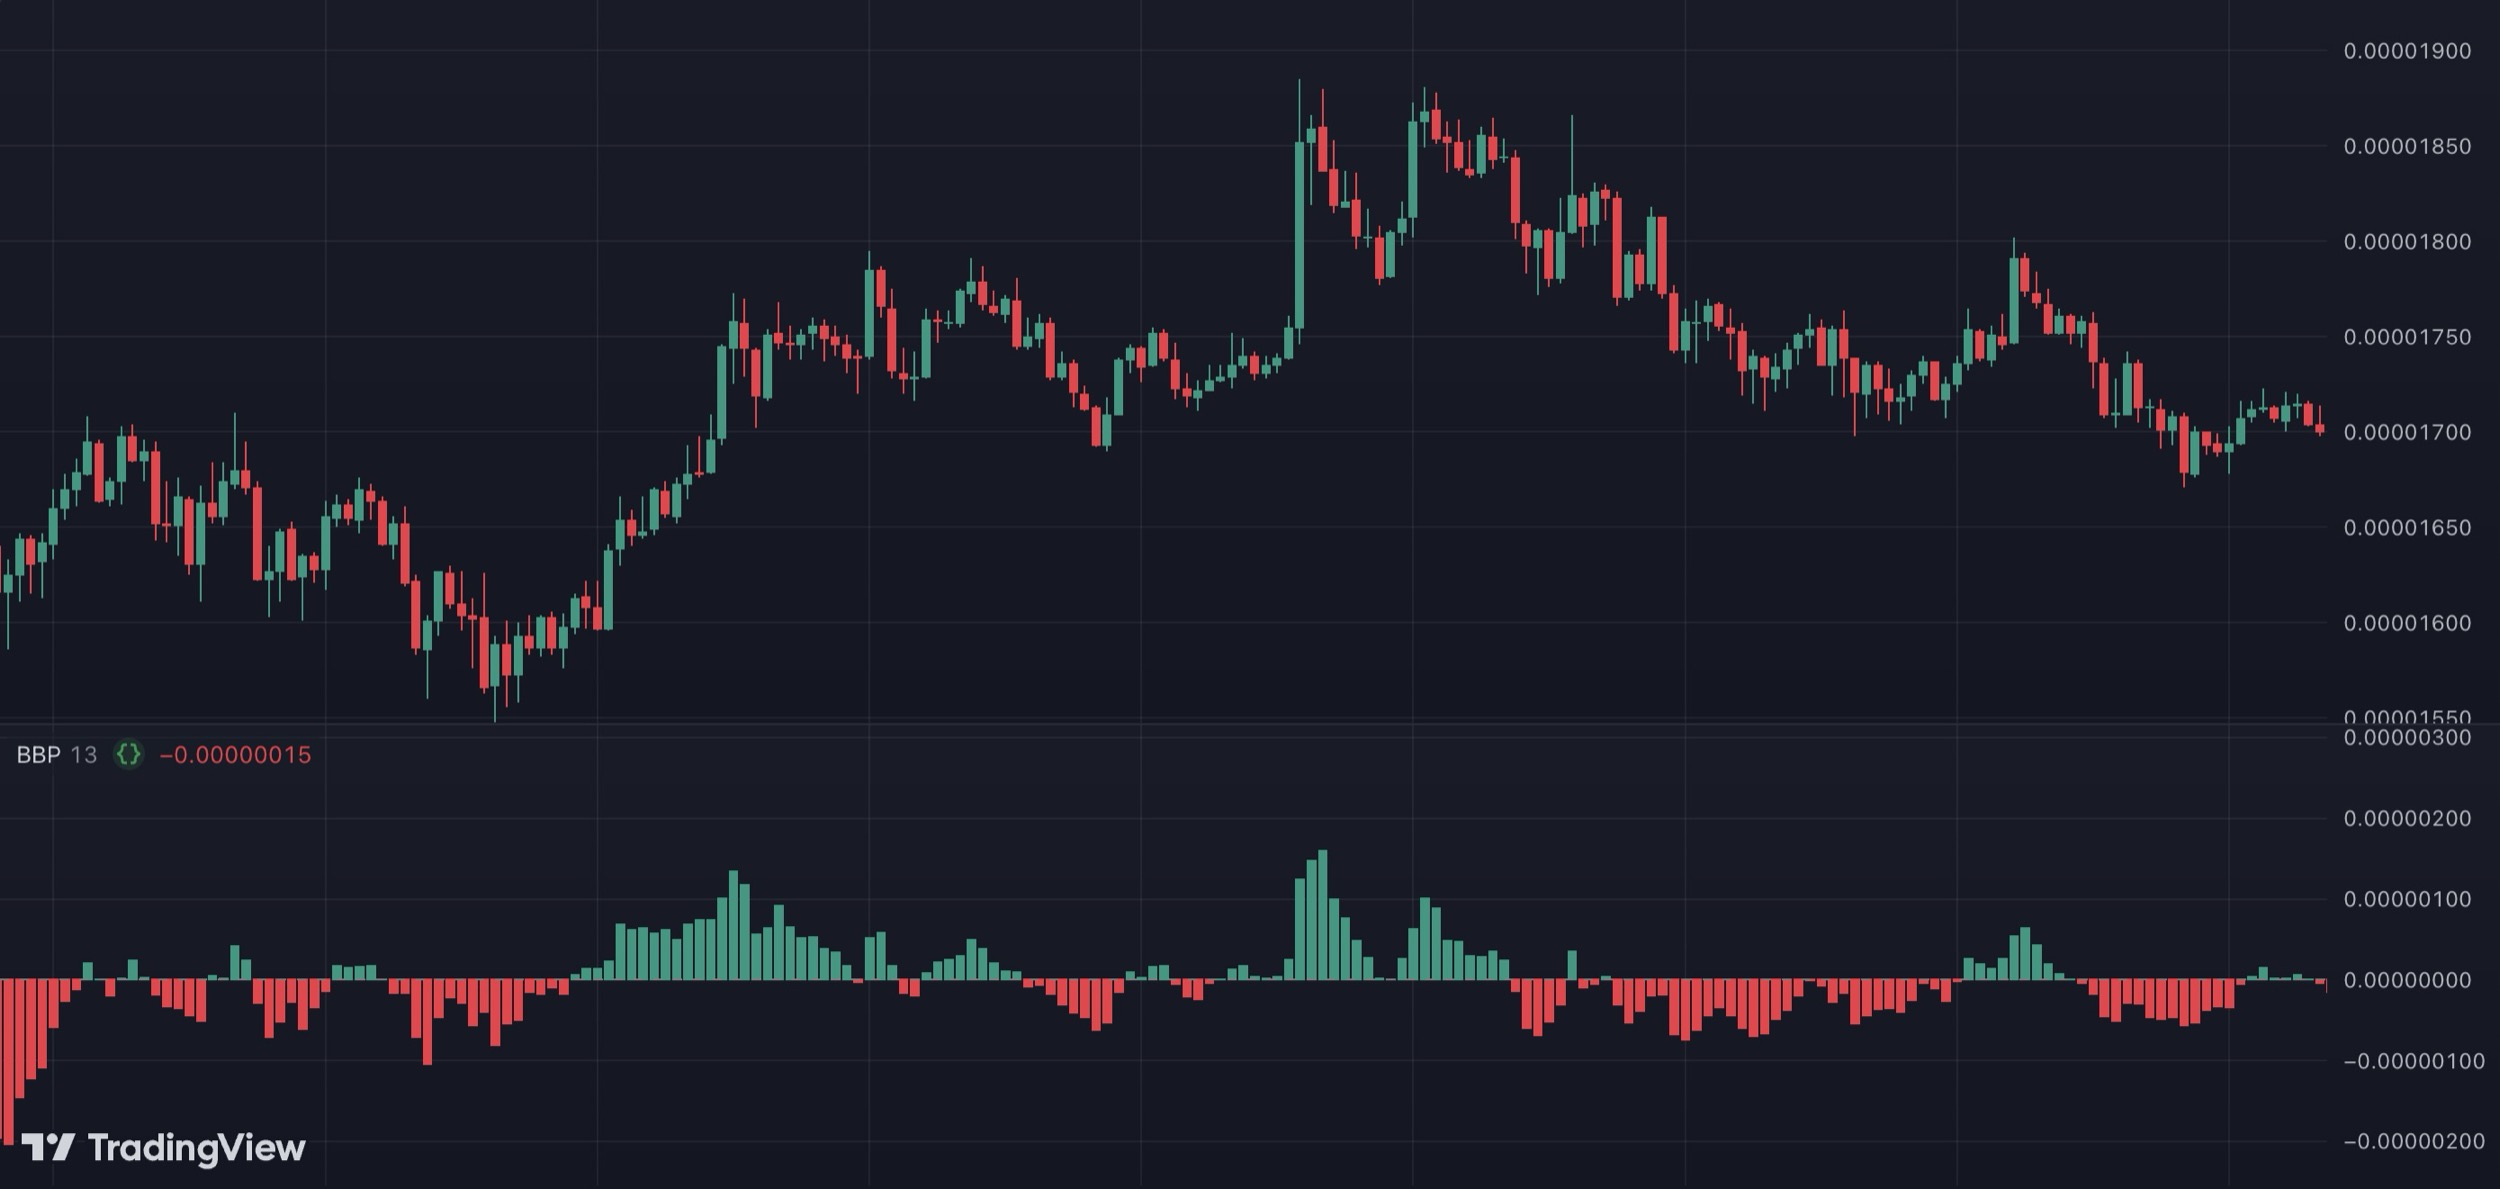
The Bull Bear Power indicator is a technical analysis tool that helps traders gauge the balance between bullish and bearish pressure in the market. By analyzing price trends and measuring the strength of buyers and sellers, this indicator can be invaluable in identifying potential trend reversals and entry points, especially in highly volatile markets like cryptocurrency. In this post, we’ll explore how the Bull Bear Power indicator works, discuss how to interpret its signals, and examine its application in backtesting and automated crypto trading with bots.
What is the Bull Bear Power Indicator
The Bull Bear Power indicator was developed by Dr. Alexander Elder as a way to quantify the strength of buying and selling forces in the market. This indicator provides insight into whether bulls (buyers) or bears (sellers) are in control, helping traders determine potential entry and exit points. Bull Bear Power is calculated by measuring the difference between the highest price (bulls) and a moving average, and between the lowest price (bears) and the same moving average. This produces a line that oscillates above and below zero, signaling shifts in buying and selling power.
How Does the Bull Bear Power Indicator Work
The Bull Bear Power indicator is derived from two main components:
- Bull Power: Calculated by subtracting the moving average (usually a 13-period EMA) from the highest price of the period. A positive Bull Power value indicates that buyers are in control.
- Bear Power: Calculated by subtracting the moving average from the lowest price of the period. A negative Bear Power value suggests that sellers are stronger.
When Bull Power is above zero and Bear Power is below zero, bulls are in control. Conversely, when Bear Power is positive and Bull Power is negative, bears are dominant. The crossover of these power lines around the zero line provides insight into potential trend reversals or the continuation of the existing trend.
Using Bull Bear Power in Crypto Trading
Identifying Trend Direction
The Bull Bear Power indicator can help identify the prevailing trend. When Bull Power is consistently above zero, it signals a bullish trend, suggesting traders may consider buying opportunities. On the other hand, when Bear Power remains below zero, it indicates a bearish trend, encouraging traders to consider selling or shorting.
Spotting Reversals with Crossovers
The crossover of Bull Power and Bear Power around the zero line can act as a signal for trend reversals. For instance:
- Bullish Reversal: If Bear Power starts rising from negative territory and crosses above the zero line, it may indicate a shift from bearish to bullish momentum.
- Bearish Reversal: If Bull Power drops and crosses below the zero line, it may signal a shift from bullish to bearish sentiment.
These crossovers provide valuable insights into market sentiment, allowing traders to anticipate shifts in buying and selling pressure.
Combining with Other Indicators
While Bull Bear Power is effective on its own, pairing it with additional indicators can enhance accuracy:
- Moving Averages: Using a longer-term moving average alongside Bull Bear Power can help confirm the trend, ensuring traders don’t enter trades against the prevailing trend.
- RSI (Relative Strength Index): Adding RSI can help validate whether the market is overbought or oversold, making Bull Bear Power signals more reliable.
- MACD (Moving Average Convergence Divergence): MACD provides momentum confirmation, helping to strengthen Bull Bear Power signals when MACD aligns with bullish or bearish momentum.
- Bollinger Bands: Combining Bollinger Bands with Bull Bear Power helps identify potential breakouts and reversals. For instance, Bull Bear Power showing bullish strength while price touches the lower Bollinger Band can signal a strong buying opportunity.

Advantages and Limitations
Advantages:
- Clear Buy and Sell Signals: Bull Bear Power provides straightforward signals by highlighting the shifts in market control between buyers and sellers.
- Adaptable to Different Timeframes: The indicator can be used effectively across short and long timeframes, making it versatile for various trading styles.
- Works Well in Trending Markets: Bull Bear Power is particularly effective in trending markets, where it can capture shifts in momentum with fewer false signals.
Limitations:
- Whipsaws in Sideways Markets: In range-bound markets, the Bull Bear Power indicator may produce false signals due to frequent crossovers around the zero line. Using trend indicators as a filter can help reduce these false entries.
- Lagging Nature: Since it’s based on moving averages, Bull Bear Power may lag behind price action, causing delayed entries or exits in rapidly changing markets. Combining it with leading indicators like RSI can improve timing.
Practical Tips for Using Bull Bear Power
- Adjust Timeframes Based on Volatility: For highly volatile assets, using a longer timeframe (like 4-hour or daily) may reduce noise and produce more reliable signals.
- Combine with Trend Confirmation: To avoid false entries in choppy markets, consider adding a moving average filter or checking for alignment with other trend indicators.
- Set Clear Exit Rules: To protect gains, use a trailing stop loss or define exit points, such as a crossover of Bear Power above zero after a long position.
