
The Relative Strength Index (RSI) is a cornerstone indicator in the world of technical analysis, widely used by traders to gauge the momentum of price movements. In the volatile landscape of cryptocurrency trading, RSI is an invaluable tool for identifying potential buying and selling opportunities. This article will delve into the mechanics of RSI, how to interpret its signals, and how to leverage it for backtesting crypto trading strategies and automated trading using crypto trading bots.
What is RSI?
The Relative Strength Index was developed in the late 1970s by J. Welles Wilder Jr., who sought to create a tool to measure the speed and change of price movements, giving traders insights into the market’s momentum. Originally used in traditional asset classes like stocks and commodities, the RSI quickly gained popularity due to its simplicity and effectiveness. With the rise of cryptocurrency, RSI has proven equally valuable in assessing this highly volatile market. By identifying overbought and oversold conditions, RSI helps traders make more informed decisions, particularly in markets where price swings are common and often sudden. Its enduring use across markets highlights its importance and flexibility as a momentum indicator.
How Does RSI Work?
The RSI calculation begins by determining the average gain and average loss over the chosen period, typically 14 periods. Positive price changes contribute to the average gain, while negative changes contribute to the average loss. The relative strength (RS) is then calculated as the average gain divided by the average loss. Finally, the RSI formula is applied as:
RSI = 100 - [100 / (1 + RS)]
When the average gain is much higher than the average loss, RSI moves closer to 100, signaling an overbought condition. If the average loss outweighs the gain, RSI moves closer to 0, signaling an oversold condition.
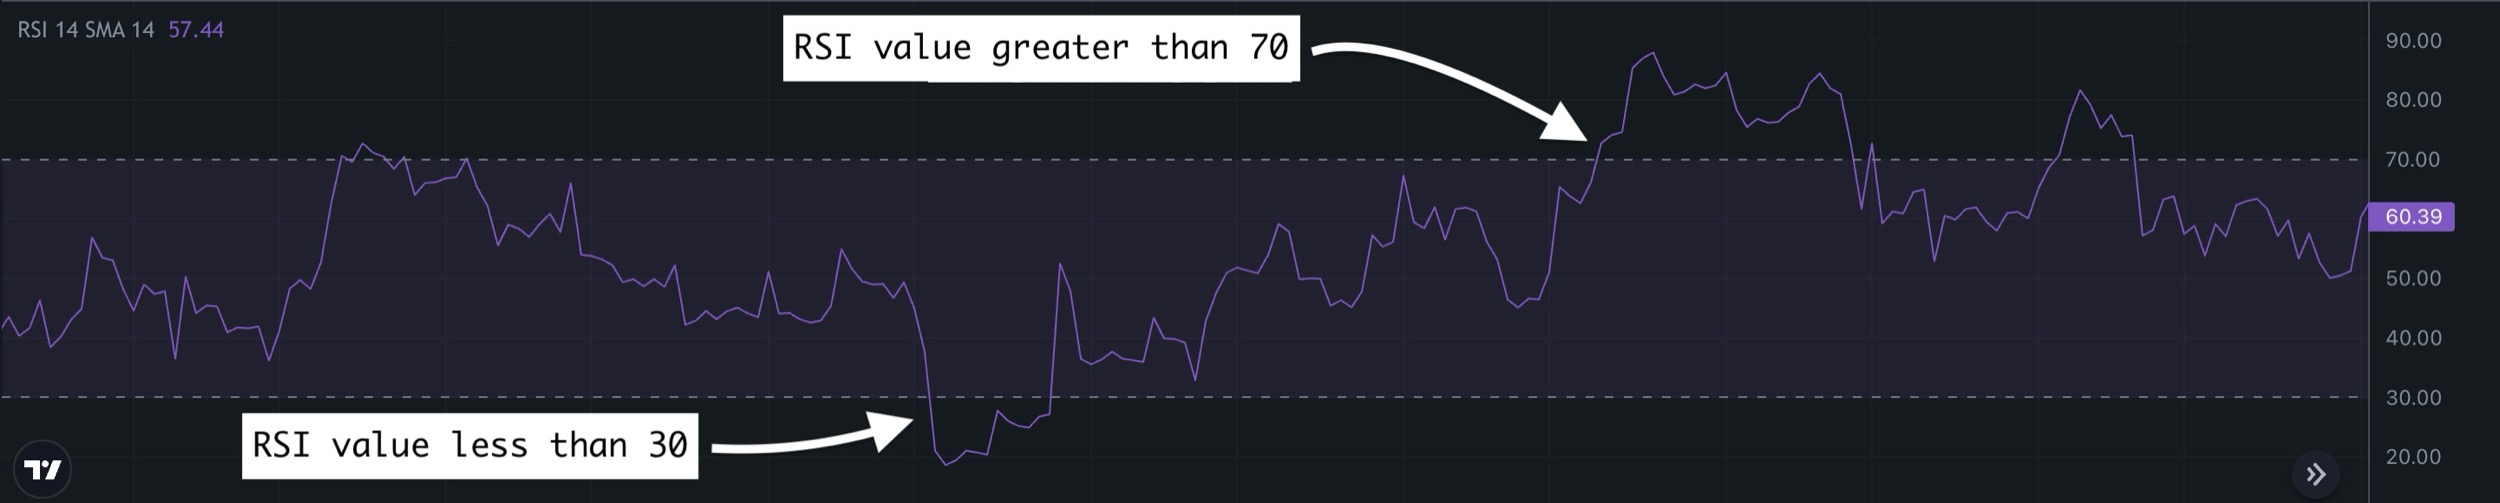
- Overbought Condition: An RSI value above 70 suggests that an asset may be overbought or overvalued, indicating a potential pullback.
- Oversold Condition: An RSI value below 30 indicates that an asset may be oversold or undervalued, signaling a possible upward correction.
Interpreting RSI Signals
Overbought and Oversold Levels
- Above 70 (Overbought): Prices have risen sharply, and a correction may be imminent.
- Below 30 (Oversold): Prices have fallen steeply, and a rebound might be on the horizon.
Divergences
- Bullish Divergence: When the price makes a new low, but the RSI forms a higher low. This could indicate a potential upward reversal.
- Bearish Divergence: When the price reaches a new high, but the RSI records a lower high. This may signal an upcoming downward reversal.
Centerline Crossovers
- Above 50: Indicates upward momentum.
- Below 50: Suggests downward momentum.
How to Use RSI with Other Indicators
While RSI is effective on its own, combining it with other indicators can improve accuracy and provide more robust signals. Here are some popular combinations:
- RSI with Moving Averages: Moving averages (MAs) are useful for identifying trends. By combining RSI with a moving average, traders can confirm trends and spot potential entry and exit points. For instance, if RSI indicates an overbought condition while the price is also above the 50-period moving average, it might signal a potential sell. Conversely, if RSI is oversold and the price is above a long-term moving average, it may suggest a buying opportunity in line with the trend.
- RSI with Bollinger Bands: Bollinger Bands are a volatility indicator, and they complement RSI by indicating price extremes. If the RSI reaches an overbought level while the price touches the upper Bollinger Band, it can be a strong indication that the asset is due for a pullback. Similarly, an oversold RSI combined with the price hitting the lower Bollinger Band suggests a potential reversal to the upside.
- RSI with MACD (Moving Average Convergence Divergence): MACD is another momentum indicator that uses moving averages to determine trend direction and strength. When combined with RSI, it provides additional confirmation for entry and exit points. For example, if RSI indicates an oversold level and MACD shows a bullish crossover, it can reinforce a buy signal.
You can explore a variety of combinations and strategies using our crypto strategy backtester and then easily convert your strategy to a smart trading bot that works 24/7 for you. You can also leverage Smart Alert Bots to get cryptocurrency indicator alerts.
Adjusting the RSI Periods for Different Strategies
While the standard RSI period is set to 14, adjusting the period can help tailor RSI’s sensitivity to different trading styles:
- Short-Term Trading (High Sensitivity): Traders focused on short-term moves often reduce the RSI period to 7 or even 5. A lower period setting makes the RSI more responsive to recent price changes, allowing traders to capture smaller, quicker market moves. This can be beneficial for day traders but also tends to create more frequent signals, some of which may be false.
- Long-Term Trading (Low Sensitivity): For longer-term traders or those looking to smooth out market noise, increasing the RSI period to 20 or even 30 can be effective. A higher period setting means RSI reacts more gradually to price changes, which can help avoid the whipsaws common in shorter timeframes. Long-term traders benefit from these smoother signals, which are less prone to frequent fluctuations and false signals.
Choosing the right period depends on the trader’s goals, risk tolerance, and preferred timeframe. Testing different settings to see which period aligns best with your trading style is often a valuable first step in using RSI effectively.
Using RSI in Bull and Bear Markets
RSI behaves differently depending on whether the market is bullish (uptrend) or bearish (downtrend), which can help refine its signals:
- In Bull Markets: During a strong uptrend, RSI values tend to stay above 30 and frequently reach levels between 70 and 80 without necessarily indicating an immediate pullback. In this context, traders might consider adjusting the overbought threshold to 80 to avoid prematurely exiting a long position. RSI signals in a bull market should ideally be interpreted with the trend in mind; overbought conditions may suggest a short-term pullback rather than a complete trend reversal.
- In Bear Markets: In a downtrend, RSI values are more likely to stay below 70 and may reach oversold levels around 20 or 25 before a reversal. Here, a trader might consider lowering the oversold threshold to 25 to capture more accurate buy signals. By recognizing that RSI values behave differently in bearish conditions, traders can adjust their entries and exits to better align with the prevailing market trend.
Practical Tips for Trading with RSI
Be Mindful of Timeframes
The timeframe you choose can impact RSI’s accuracy. Shorter timeframes (e.g., 5-minute or 15-minute) will yield more frequent signals but may be less reliable due to noise, while longer timeframes (e.g., daily or weekly) offer more consistent signals but fewer trade opportunities. Experimenting with different timeframes helps find the best fit for your strategy.
Adjust Overbought/Oversold Thresholds
Although 70 and 30 are standard levels, adapting these thresholds based on market conditions can provide better signals. For example, in a trending market, consider setting the thresholds at 80 and 20 to reduce the likelihood of entering a trade against the trend.
Use RSI for Confirmation Rather than Initiation
Treat RSI as a confirmation tool rather than a standalone indicator for trade initiation. Combine RSI signals with price action or other technical indicators to increase the probability of successful trades.
Set Realistic Goals
Since RSI is a momentum-based indicator, it performs best in identifying potential reversals rather than pinpointing exact entry or exit points. Use RSI to help you gauge the trend's strength and assess the likelihood of reversals, but always set realistic expectations and targets.
Common Mistakes and Misinterpretations of RSI
Despite its simplicity, RSI can sometimes be misinterpreted. Here are a few common pitfalls to watch out for:
Over-reliance on RSI Alone: While RSI is powerful, it should ideally be used alongside other indicators to confirm signals. Solely relying on RSI may lead to false signals, especially in a strong trending market where overbought/oversold conditions may persist longer than expected.
Ignoring Divergences: Divergence is a key signal RSI provides, yet it is often overlooked by traders. When RSI diverges from price (e.g., RSI moves up while price moves down), it can be an early warning of a potential reversal, making it essential to include in analysis.
Misinterpreting Overbought and Oversold Levels: Overbought does not always mean the price is about to fall, nor does oversold necessarily signal a reversal upwards. In strong trends, RSI can remain overbought or oversold for extended periods, which can lead to missed opportunities if traders interpret these levels as immediate reversal signals.