
The Commodity Channel Index (CCI) is a valuable momentum indicator that helps traders identify potential reversals and detect overbought or oversold conditions. Originally developed for commodities by Donald Lambert in the 1980s, CCI has since become a favorite tool across various asset classes, including cryptocurrencies. With its adaptability to different timeframes and responsiveness to price shifts, CCI is especially useful for crypto traders who seek to capitalize on the rapid price changes common in this market. In this post, we’ll explore how CCI works, discuss how to interpret its signals, and examine how it can be used in both our crypto strategy backtester and automated crypto trading strategies with trading bots.
What is the Commodity Channel Index (CCI)
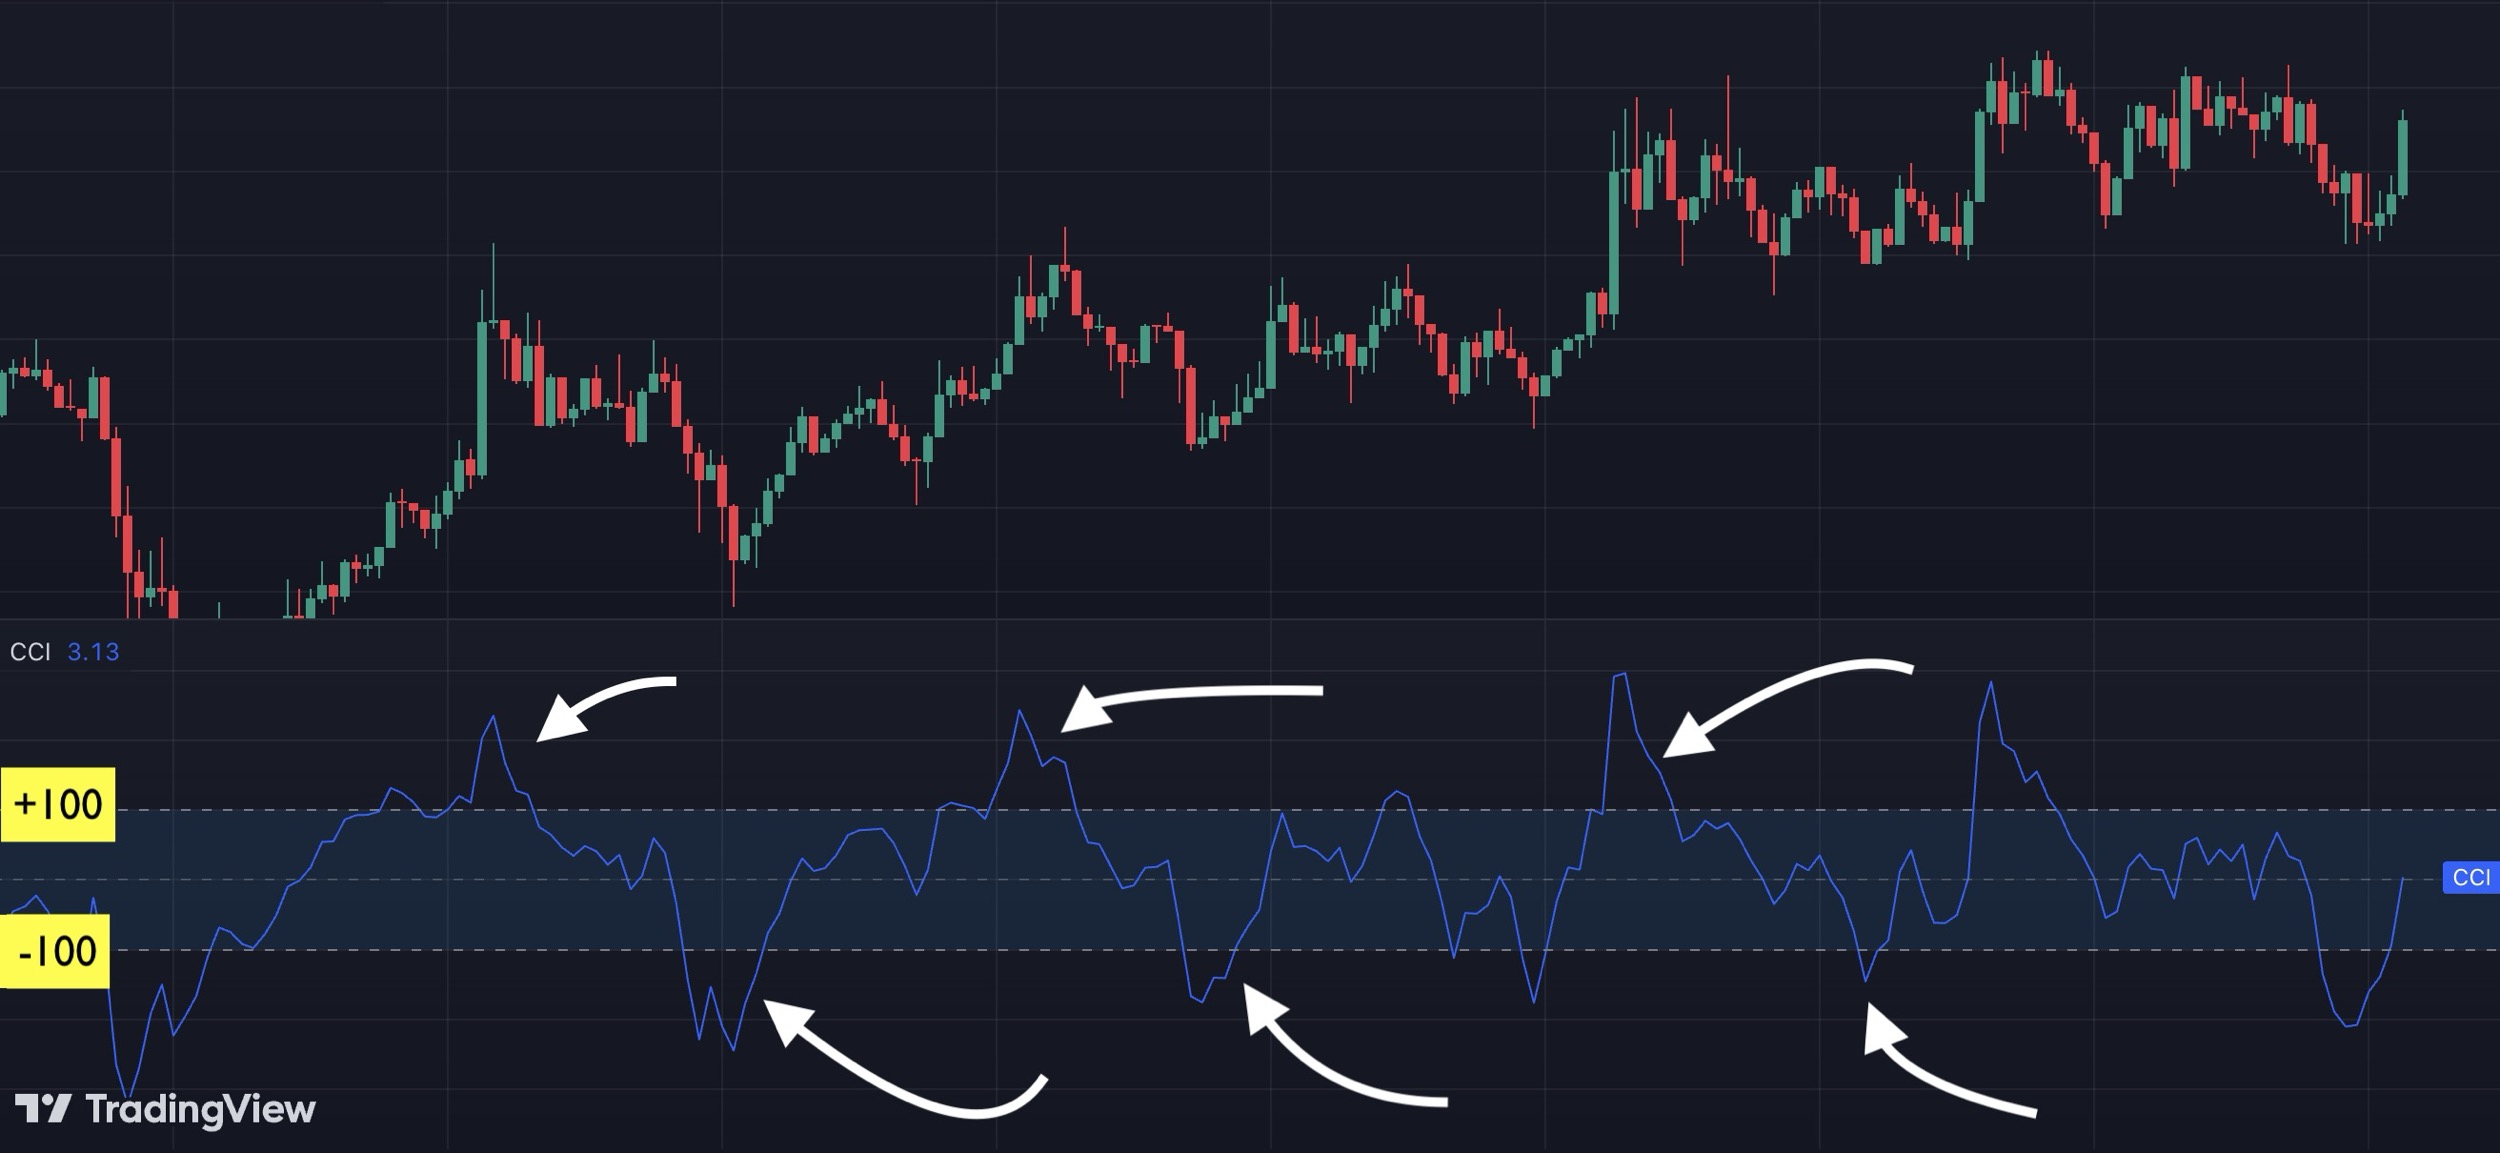
The Commodity Channel Index (CCI) measures the difference between an asset’s current price and its historical average over a specific period. This difference is divided by the average deviation to create a dynamic indicator that oscillates around zero, allowing traders to gauge whether an asset is relatively strong or weak. Values above +100 suggest an asset may be overbought, while values below -100 imply it might be oversold. These levels are not absolute, but they help traders interpret the overall market sentiment and anticipate potential reversals.
How Does the CCI Work
The CCI calculation consists of a few straightforward steps:
- Calculate the Typical Price: This is the average of the high, low, and close prices for each period.
- Determine the Moving Average of the Typical Price: This average is taken over a set period, commonly 20 days.
- Calculate Average Deviation: This is the average distance of each period’s typical price from the moving average.
- Apply the CCI Formula: CCI = (Typical Price - Moving Average) / (0.015 × Average Deviation).
The constant "0.015" serves as a scaling factor, standardizing the CCI values around zero. This scaling makes it easier to interpret values, with readings above +100 signaling a potential overbought condition and those below -100 indicating possible oversold conditions.
Interpreting CCI Signals
Identifying Overbought and Oversold Conditions
In crypto trading, CCI’s ability to spot overbought and oversold levels is especially helpful due to the market’s high volatility. When the CCI moves above +100, it suggests that the asset may be overbought and due for a pullback. Conversely, when the CCI dips below -100, it signals a potential oversold condition, indicating a possible upward correction. These thresholds help traders time entries and exits in trending markets.
Detecting Trend Reversals
The CCI is also effective at spotting potential trend reversals. When the CCI crosses from positive to negative territory (or vice versa), it often signals a shift in market sentiment. For instance, a CCI that crosses above zero could indicate that bullish momentum is building, while a drop below zero might suggest increasing bearish pressure. This makes CCI a versatile tool, allowing traders to anticipate shifts in trend direction and adjust their strategies accordingly.
Combining CCI with Other Indicators
To enhance accuracy, many traders combine CCI with other indicators. For example:
- Moving Averages: Pairing CCI with a moving average can confirm trend direction and avoid false signals. If the CCI signals overbought, but the price remains above a long-term moving average, traders might hold off on selling until there’s additional confirmation.
- RSI (Relative Strength Index): Adding RSI to CCI setups allows traders to cross-reference momentum. When both CCI and RSI indicate overbought or oversold conditions, the signal is considered stronger.
- MACD (Moving Average Convergence Divergence): MACD can provide momentum confirmation, helping to validate CCI signals by indicating whether momentum is aligning with the trend.
Want to get instant notification of market movements? You can use our smart alert bots to get cryptocurrency indicator alerts.
CCI in Different Timeframes
The CCI can be adapted to various timeframes, making it useful for both intraday and long-term traders. For short-term trading, a lower period CCI (like 5 or 10) provides faster signals, allowing traders to capture quick market movements. For long-term strategies, a higher period CCI (such as 20 or 30) smooths out price action and helps identify more sustained trends. Choosing the right timeframe depends on each trader’s goals and the asset’s volatility.
Common CCI Trading Strategies
CCI Trend-Following Strategy
This strategy involves going long when the CCI crosses above zero and staying in the trade until it dips below zero. The zero line serves as a trend indicator, helping traders align with the broader market movement. In volatile crypto markets, using a trend-following strategy can help traders avoid sudden reversals and stay in winning trades longer.
CCI Divergence Strategy
Divergence occurs when the asset price and CCI move in opposite directions, hinting at a potential reversal. A bullish divergence (price makes a lower low while CCI makes a higher low) suggests an upward reversal might be coming. A bearish divergence (price makes a higher high while CCI makes a lower high) indicates a possible downward shift. Divergence trading helps identify turning points, making it a popular strategy for crypto traders.
Advantages and Limitations of CCI
Advantages:
- Adaptable to Different Markets and Timeframes: CCI works well across assets and timeframes, making it flexible for both short-term traders and long-term investors.
- Effective in Identifying Extremes: CCI is a reliable tool for spotting overbought and oversold conditions, especially in volatile markets like crypto.
- Helps Identify Early Trend Reversals: CCI’s ability to cross zero enables traders to spot potential reversals early and adapt to changing trends.
Limitations:
- Sensitivity to Market Noise: CCI can produce frequent signals in choppy or sideways markets, leading to potential false entries. Adjusting the period length or combining it with other indicators can help mitigate this.
- Lagging Nature: Like most indicators, CCI is based on historical data and may lag, especially in fast-moving markets. To counteract this, traders often use CCI in combination with other indicators to increase reliability.