The Ichimoku Cloud is a powerful technical analysis tool that provides a holistic view of price action, trends, support, and resistance. Originally developed by Japanese journalist Goichi Hosoda in the late 1930s, the Ichimoku Cloud is widely used today by traders across various markets, including cryptocurrency, to gain a deeper understanding of market dynamics. Unlike traditional indicators that focus on one aspect of the market, the Ichimoku Cloud combines multiple elements to provide a comprehensive picture, helping traders make informed decisions.In this post, we’ll break down the components of the Ichimoku Cloud, how to interpret its signals, and the ways you can use it to identify potential entry and exit points. We’ll also discuss how to backtest crypto trading strategies and how it can be integrated into automated crypto trading.
What is the Ichimoku Cloud?
The Ichimoku Cloud, also known as "Ichimoku Kinko Hyo," translates to "one look equilibrium chart." This name reflects the indicator's purpose: to give traders a complete view of the market at a glance. The Ichimoku Cloud is composed of five lines that work together to show trends, momentum, and support and resistance levels. It is especially useful in identifying areas of equilibrium in the market, where supply and demand balance each other.
Each component of the Ichimoku Cloud serves a specific purpose, helping traders confirm trends and spot potential reversals.
Breaking Down the Components of the Ichimoku Cloud
The Ichimoku Cloud consists of five main lines:
- Tenkan-sen (Conversion Line): This is the average of the highest high and lowest low over the past 9 periods. It’s a faster-moving line that indicates short-term price direction.
- Kijun-sen (Base Line): Calculated as the average of the highest high and lowest low over the past 26 periods, this line shows medium-term momentum. It acts as a stronger support/resistance level and is often used to confirm trends.
- Senkou Span A (Leading Span A): This line is the average of the Conversion Line and Base Line, plotted 26 periods ahead. It forms the first boundary of the cloud.
- Senkou Span B (Leading Span B): This is the average of the highest high and lowest low over the past 52 periods, also plotted 26 periods ahead. It forms the second boundary of the cloud.
- Chikou Span (Lagging Span): This is the current price, shifted 26 periods into the past. It serves as a confirmation tool, helping to validate trends and detect potential reversals.
Understanding the Ichimoku Cloud Signals
The Ichimoku Cloud provides a variety of signals that traders use to make informed trading decisions. Here are the key signals to watch:
- Cloud Color and Trend: When the cloud (formed by Span A and Span B) is green, it indicates a bullish trend, while a red cloud signals a bearish trend. The cloud's thickness shows the strength of support or resistance.
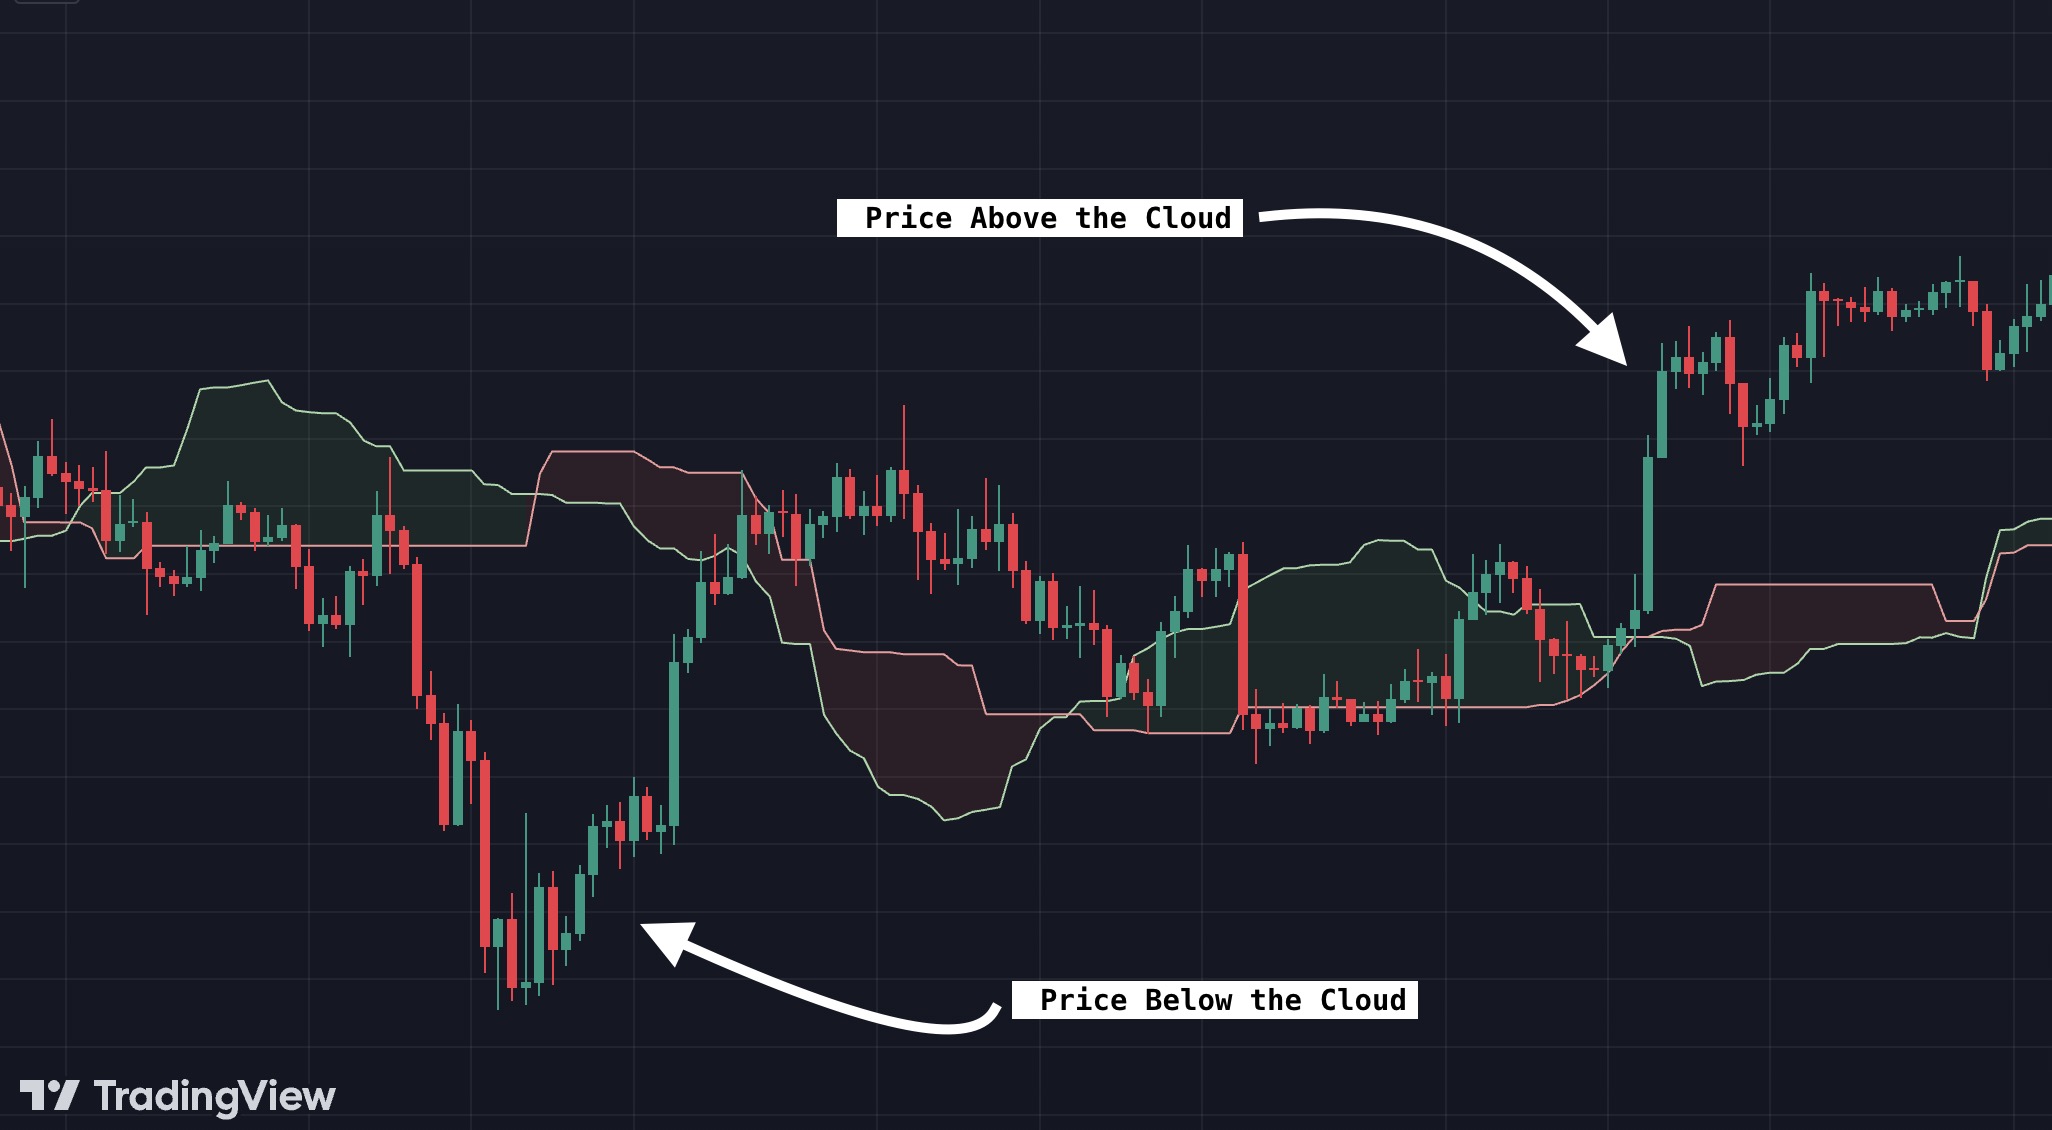
- Price Relative to the Cloud: If the price is above the cloud, it suggests an uptrend, while a price below the cloud indicates a downtrend. When the price is within the cloud, the market is likely in a consolidation phase, and a breakout could occur in either direction.
Crossovers of Conversion and Base Lines: When the Conversion Line crosses above the Base Line, it’s a bullish signal, indicating upward momentum. Conversely, when the Conversion Line crosses below the Base Line, it’s a bearish signal, suggesting downward momentum. - Lagging Span Confirmation: The Lagging Span helps confirm trends when it moves in the same direction as the price. If the Lagging Span is above the cloud and the price, it supports a bullish trend, while a position below the cloud and price supports a bearish trend.
Ichimoku Cloud in Volatile Markets
The Ichimoku Cloud proves particularly useful in volatile markets like cryptocurrency, where rapid price fluctuations are common. Unlike single-line indicators, the Ichimoku Cloud’s multi-faceted approach helps traders adapt to sudden shifts by identifying potential reversals and filtering out weak trends. The cloud itself serves as a “buffer zone” in periods of high volatility. For example, if the price moves into the cloud during a strong trend, traders may view this as a consolidation phase rather than an immediate trend reversal. This helps prevent premature exits and provides a better understanding of price stability before re-entering a position.
Customizing Ichimoku Cloud Settings for Crypto
While the Ichimoku Cloud traditionally uses default settings (9, 26, and 52 periods), many crypto traders find that adjusting these values can improve the indicator's responsiveness to the fast-paced nature of crypto markets. For instance, shorter periods (like 6, 20, and 48) can make the Ichimoku Cloud more sensitive, generating signals quicker, which may be better suited for day trading or scalping in crypto. However, traders must balance sensitivity with reliability; overly short settings may increase noise and false signals. Experimenting with different period lengths through backtesting can reveal optimal settings for specific crypto pairs and timeframes, helping traders tailor the Ichimoku Cloud to fit their trading style.
Practical Applications of Ichimoku Cloud in Crypto Trading
The Ichimoku Cloud is well-suited for trend-following strategies, especially in volatile crypto markets. Here’s how you can apply it:
- Identifying Strong Trends: In crypto trading, capturing strong trends is key to maximizing profits. The Ichimoku Cloud enables traders to distinguish between trending and consolidating markets, helping them identify optimal entry points during strong trends.
- Support and Resistance Zones: The cloud itself acts as a dynamic support or resistance area. For instance, during an uptrend, the upper edge of the cloud serves as support. Traders often place stop-loss orders just below the cloud to protect against reversals.
- Entry and Exit Signals: The crossovers of the Conversion and Base Lines serve as straightforward buy or sell signals. These signals are even more reliable when confirmed by the cloud color and the Lagging Span.
Combining Ichimoku Cloud with Other Indicators
While the Ichimoku Cloud is powerful on its own, combining it with other indicators can enhance its effectiveness. Here are some common combinations:
- Relative Strength Index (RSI): RSI can help confirm if a trend is overextended. For example, if the Ichimoku Cloud signals a bullish trend, but the RSI shows overbought conditions, a pullback may be imminent.
- Moving Averages: Adding moving averages can provide an extra layer of trend confirmation, especially in highly volatile markets. A 50-day or 200-day moving average, for instance, can help confirm the long-term trend indicated by the Ichimoku Cloud.
- Volume Indicators: Using volume as a secondary confirmation can help validate breakouts above or below the cloud. For instance, if a price moves above the cloud on high volume, it’s a stronger buy signal than a low-volume breakout.
Advantages and Limitations of Ichimoku Cloud
Advantages:
- Comprehensive View: The Ichimoku Cloud provides insights into trend direction, momentum, and support/resistance in one glance, making it a powerful standalone tool.
- Adaptability: Works across various time periods and markets, making it versatile for crypto trading.
- Early Trend Detection: The Ichimoku Cloud can help traders catch trends early, especially when combined with additional indicators.
Limitations
- Complexity: The Ichimoku Cloud can be intimidating for beginners due to its multiple components.
- Less Effective in Sideways Markets: Like many trend-following indicators, the Ichimoku Cloud may produce false signals in choppy or range-bound markets.