Fair Value Gaps (FVGs) are essential areas on a price chart that highlight market inefficiencies caused by rapid price movements. These gaps, often left unfilled, create opportunities for traders to anticipate potential price retracements or continuations. Recognizing and utilizing FVGs can provide a significant edge in trading, but manually identifying them can be challenging and time-intensive. With tools like LuxAlgo on TradingView, traders can streamline the process by automating FVG detection and integrating trading bots to execute trades based on these imbalances. This approach not only saves time but also ensures precision and consistency, making it an invaluable strategy for modern traders.
What Are Fair Value Gaps (FVGs)
Fair Value Gaps (FVGs) are areas on a price chart that represent imbalances in the market caused by rapid price movements. These imbalances occur when price moves so quickly that not all buy and sell orders in the market are filled, leaving behind a “gap” in liquidity. These gaps are often created during periods of high volatility, such as after the release of major economic news or during strong trending markets. Traders and institutions view these gaps as significant levels because price often retraces to fill them, creating opportunities to enter or exit trades.
FVGs are an advanced concept commonly used by traders who follow price action strategies, as they provide insight into where institutional players may have left unfilled orders. By identifying these areas, traders can anticipate where price might revisit, offering a structured approach to trading pullbacks or continuations.
Understanding Market Imbalances and FVGs
To fully understand Fair Value Gaps, it’s essential to grasp the concept of market imbalances. In a balanced market, there is an equilibrium between buyers and sellers at each price level, ensuring that every buy order is matched with a sell order. However, during periods of high momentum, such as a strong bullish or bearish move, this equilibrium is disrupted. For example, in a bullish market, a sudden influx of buy orders may overwhelm the available sell orders, causing price to “jump” several levels without filling all the intermediate sell orders.
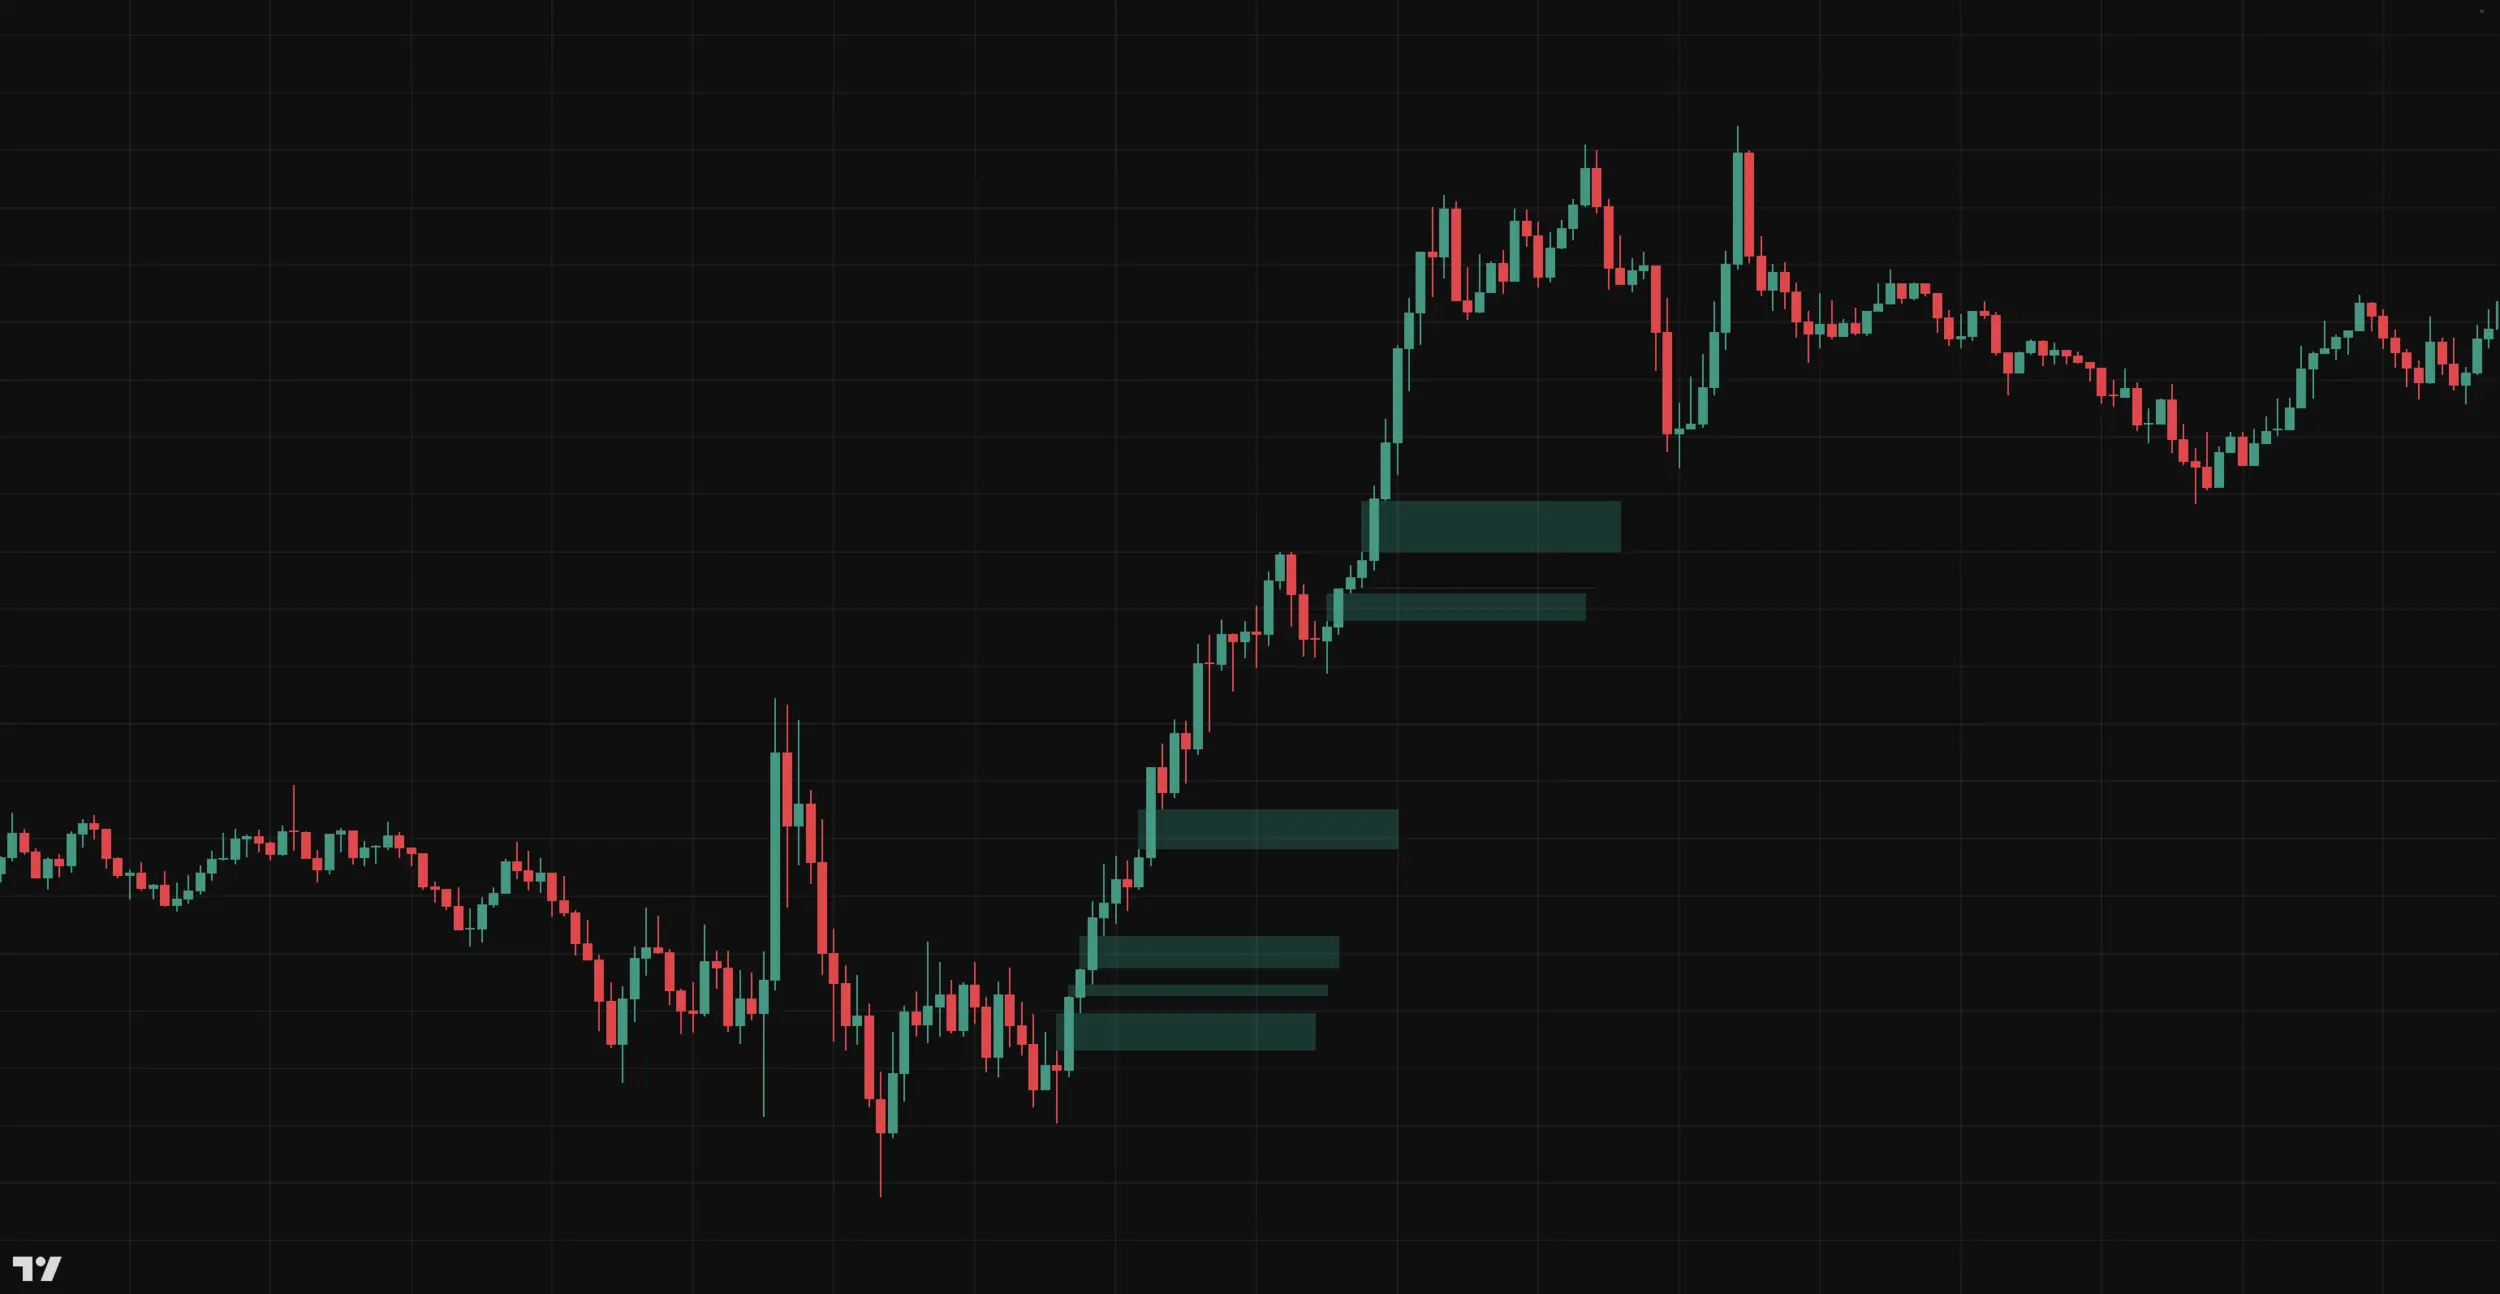
This creates an imbalance, leaving a gap in the price chart. In practical terms, a Fair Value Gap is the area between the high of one candlestick and the low of another, typically within a three-candlestick sequence:
- Candlestick 1: A strong move initiates the gap (e.g., a large bullish or bearish candlestick).
- Candlestick 2: The gap is formed between the low and high of this candlestick, as price moves too fast to fill orders in between.
- Candlestick 3: Price may eventually retrace to this gap to “fill” the imbalance.
For example, in a bullish scenario, if a strong green candlestick (Candlestick 1) pushes price rapidly upward and the following candlestick (Candlestick 2) leaves a gap between its low and the high of Candlestick 1, this area becomes the Fair Value Gap. Traders then watch for price to return to this zone, looking for potential bullish entries as the gap fills.
Why Fair Value Gaps Are Important in Trading
Fair Value Gaps are critical for traders because they act as magnets for price action. Markets are inherently drawn to areas of imbalance, as they tend to seek equilibrium. This behavior makes FVGs reliable zones for predicting potential price reactions. Here are a few key reasons why FVGs are important:
- Price Retracement Opportunities: When an FVG forms, it often signals that price is likely to revisit that area in the future. For example, in a bullish trend, price may retrace to a Fair Value Gap, allowing traders to enter long positions at a more favorable price before the trend resumes.
- Institutional Activity: Fair Value Gaps are often linked to institutional trading activity. Large buy or sell orders placed by institutions can cause these gaps, as their orders dominate liquidity. By identifying FVGs, retail traders can align their strategies with the “smart money.”
- Improved Risk-to-Reward Ratios: Trading around FVGs allows traders to define clear stop-loss levels and target areas, improving their overall risk management. For example, a trader entering a trade at the lower boundary of a bullish FVG can place a stop-loss just below the gap and set a profit target based on the next resistance level.
- Support and Resistance Zones: FVGs can act as dynamic support or resistance zones. For instance, a bullish FVG might serve as a temporary support level where price bounces, while a bearish FVG might function as resistance where price struggles to break through.
By incorporating FVGs into their analysis, traders gain an edge in predicting price movements, timing entries and exits, and understanding market behavior at a deeper level.
Key Characteristics of Fair Value Gaps
To effectively use Fair Value Gaps in trading, it’s important to recognize their key characteristics. Below are some of the most important traits that define FVGs:
- Formation During Strong Moves: FVGs are typically formed during periods of high volatility, such as during news releases or when institutional orders dominate the market. A rapid move in one direction (bullish or bearish) often leaves behind unfilled orders, creating the gap.
- Three-Candlestick Pattern: FVGs are most commonly identified within a three-candlestick sequence. The gap exists between the high of the first candlestick and the low of the third candlestick (or vice versa in bearish scenarios).
- Tendency to Get Filled: One of the defining characteristics of FVGs is that price often retraces to fill the gap. While this doesn’t happen 100% of the time, the high probability of a gap fill makes them attractive for traders. For example, in a bullish gap, price might retrace to the lower boundary of the gap before continuing the upward trend.
-
Directionality:
-
Bullish FVGs: Formed during strong upward moves; price often returns to these gaps before continuing higher.
-
Bearish FVGs: Formed during strong downward moves; price often revisits these gaps before continuing lower.
-
- Context Matters: The reliability of an FVG depends on the broader market context. For instance, in a strong uptrend, bullish FVGs are more likely to hold as support, while bearish FVGs in a downtrend are more likely to act as resistance.
- Scalability Across Timeframes: FVGs can be identified on any timeframe, from minute charts for scalpers to daily or weekly charts for swing traders. However, gaps on higher timeframes (e.g., 1D or 1W) tend to carry more significance as they reflect larger institutional activity.
For example, let’s say price on a daily chart surges from $1,000 to $1,050, leaving a Fair Value Gap between $1,020 and $1,030. Over the next few days, price retraces to $1,025 (the middle of the gap) before resuming its upward move to $1,080. A trader who recognized the FVG could have taken a long position at $1,025 with a tight stop-loss below $1,020 and profited from the continuation.
How to Trade Fair Value Gaps
Trading Fair Value Gaps (FVGs) effectively requires a systematic approach to identifying, analyzing, and executing trades based on these imbalances. FVGs offer traders clear zones for potential entries and exits, but their success depends on proper identification and integration with other trading tools. This section will break down how to identify FVGs on a chart, develop entry and exit strategies, and enhance their reliability by combining them with other indicators.
Identifying Fair Value Gaps on a Chart
The first step in trading FVGs is learning how to spot them on a price chart. Fair Value Gaps are most commonly identified in a three-candlestick sequence, where a sudden price movement leaves a “gap” between the wicks of two candlesticks. Follow these steps to locate FVGs:
- Look for Strong Momentum Candlesticks: Identify large candlesticks (bullish or bearish) that show rapid price movement, as these are most likely to create gaps. For example, a long green candlestick in an uptrend indicates strong buying pressure, while a long red candlestick in a downtrend signifies strong selling.
- Identify the Gap Between the Wicks:
- For a bullish FVG: Look for a gap between the low of the second candlestick and the high of the first candlestick.
- For a bearish FVG: Look for a gap between the high of the second candlestick and the low of the first candlestick.
- Verify the Gap with the Third Candlestick: The third candlestick should not immediately fill the gap. If it does, the FVG becomes less significant. An unfilled gap signals an imbalance that price may revisit in the future.
- Use Higher Timeframes for Confirmation: FVGs on higher timeframes (e.g., 1-hour, 4-hour, daily) tend to carry more weight and reliability compared to those on lower timeframes, as they reflect significant institutional activity.
Example: On a 4-hour chart, imagine price moves sharply upward from $1,000 to $1,050, leaving a gap between $1,030 and $1,035. This gap is a bullish FVG and indicates an area where price may return before continuing higher.
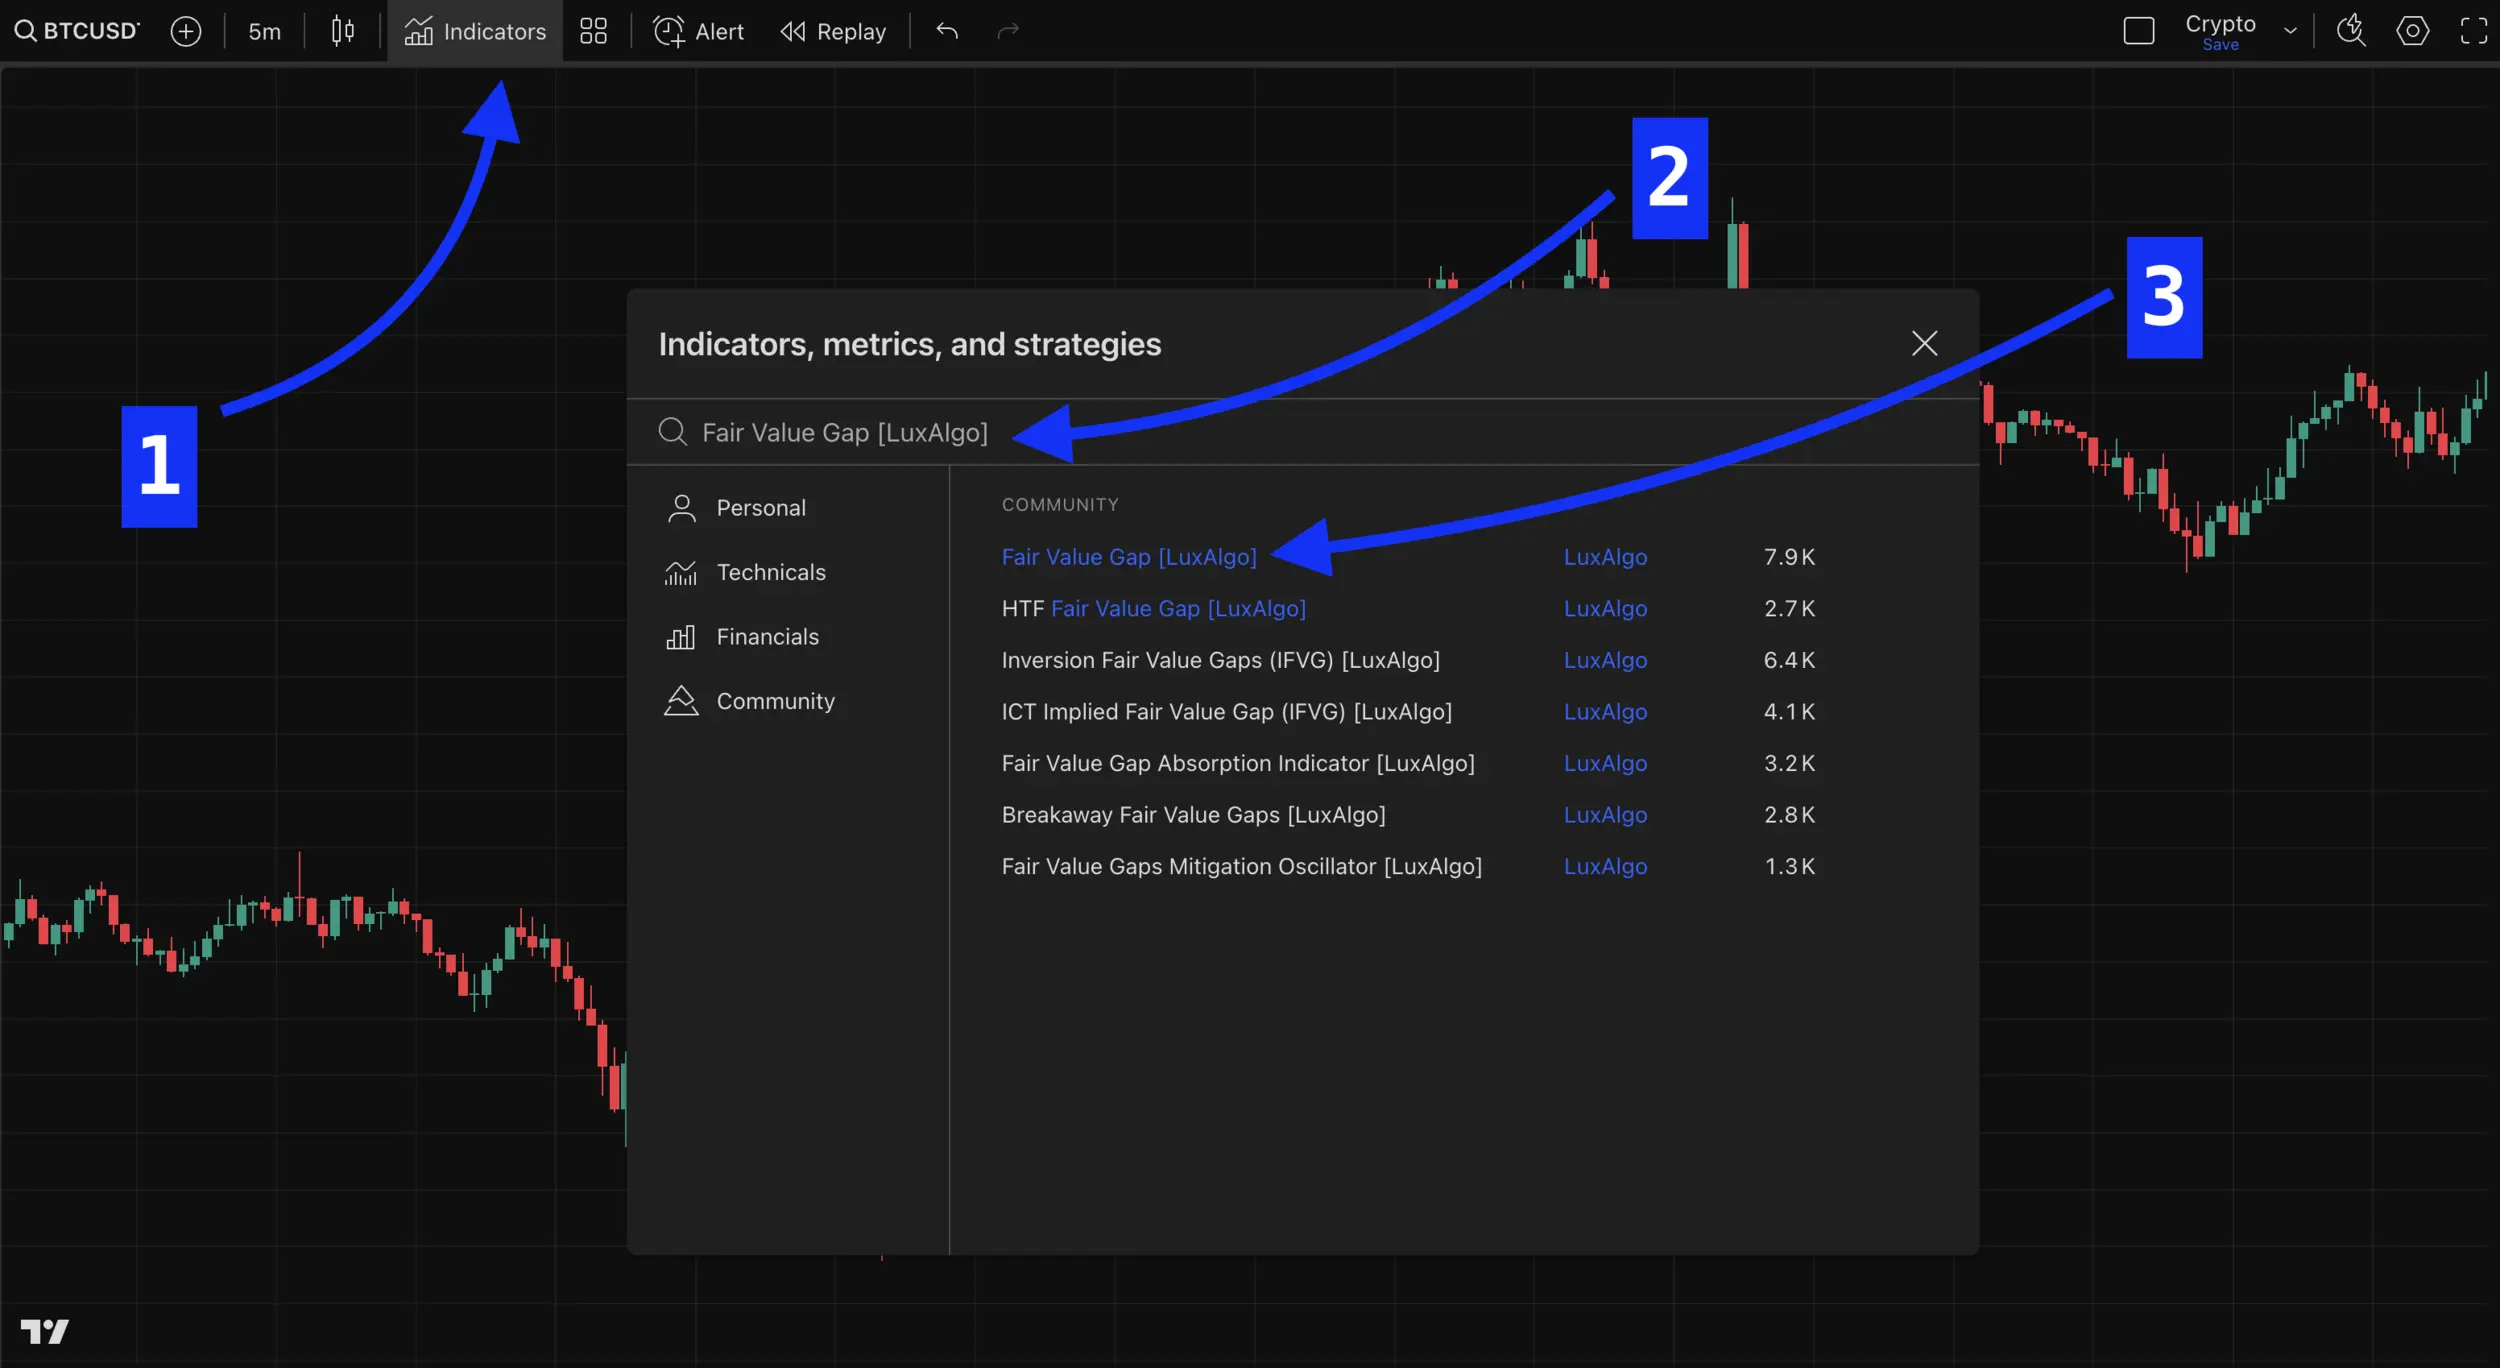
To simplify the process, indicators like "Fair Value Gap [LuxAlgo]" on TradingView can automatically highlight FVGs, ensuring traders don’t miss potential setups.
Entry and Exit Strategies Using FVGs
Once you’ve identified a Fair Value Gap, the next step is to plan your trades. FVGs provide precise zones for entering and exiting trades, but success depends on timing and understanding how price interacts with these gaps.
- Entry Strategies
- For Bullish FVGs: Wait for price to retrace into the gap. Look for signs of bullish rejection within the gap (e.g., bullish candlestick patterns like pin bars or engulfing candles). Enter a long position near the lower boundary of the gap.
- For Bearish FVGs: Wait for price to retrace into the gap. Look for bearish rejection signals within the gap (e.g., bearish candlestick patterns or resistance confirmation). Enter a short position near the upper boundary of the gap.
- Stop-Loss Placement
- For bullish FVGs, the stop-loss goes slightly below the lower boundary.
- For bearish FVGs, the stop-loss goes slightly above the upper boundary.
- Take-Profit Targets: Define your take-profit levels based on key support and resistance levels or the nearest swing high/low. You can also use a risk-to-reward ratio of at least 1:2 to ensure the trade is worth taking.
Example Trade Setup: Let’s say you spot a bullish FVG on a 1-hour chart between $1,200 and $1,210. Price retraces into the gap and forms a bullish pin bar at $1,205. You enter a long trade at $1,205 with:
- Stop-loss at $1,198 (below the gap)
- Take-profit at $1,230 (next resistance level)
If price respects the gap and resumes upward, the trade offers a favorable risk-to-reward ratio.
Automating the Fair Value Gap Trading Strategy with LuxAlgo
Automation is a game-changer for traders who want to leverage the power of Fair Value Gaps without constantly monitoring charts. By using the “Fair Value Gap [LuxAlgo]” indicator on TradingView, combined with CryptoTailor Signal Bots, you can automate trade execution and risk management around the clock. This setup not only reduces the time spent analyzing charts but also ensures consistent execution of your strategy, whether you’re trading with real money or testing in demo mode. In this section, we’ll outline how to automate the FVG trading strategy step-by-step, from setting up TradingView alerts to letting the bot handle trades.
Why Use Automation for Fair Value Gaps
Automating the Fair Value Gap strategy offers several advantages that can enhance both performance and efficiency:
- Consistency in Execution: Emotions and human errors often interfere with manual trading. Automation ensures that every signal generated by the “Fair Value Gap [LuxAlgo]” indicator is executed according to your predefined rules, without hesitation or second-guessing.
- 24/7 Market Monitoring: Markets, especially cryptocurrencies, operate around the clock. Automation allows your trading bot to monitor and act on signals 24/7, ensuring you never miss an opportunity, even when you’re asleep or away.
- Risk Management Built-In: Tools like CryptoTailor Signal Bots come equipped with advanced risk management features, such as setting stop-losses, take-profits, and position sizing based on your account balance. This ensures your trades are protected, even in volatile markets.
- Demo Mode Testing: Automation allows you to forward-test your strategy in demo mode before risking real capital. This is invaluable for refining your approach and building confidence in the system’s performance.
By automating FVG trading, you combine the analytical power of LuxAlgo with the efficiency of a trading bot, creating a streamlined and disciplined trading process.
Setting Up the Fair Value Gap [LuxAlgo] Indicator for Automation
The first step in automating your FVG trading strategy is configuring the “Fair Value Gap [LuxAlgo]” indicator on TradingView and integrating it with CryptoTailor Signal Bots. Here’s how to set it up:
- Add the Indicator to Your Chart: On TradingView, apply the “Fair Value Gap [LuxAlgo]” indicator to your preferred asset and timeframe. This indicator automatically identifies bullish and bearish FVGs, saving you the time and effort of manual analysis.
- Create Alerts for FVG Signals:
- Alert condition: “Bullish Fair Value Gap Detected.”
- Configure Webhook URL for Alerts: CryptoTailor Signal Bots rely on webhook integration to receive signals from TradingView. Copy the webhook URL provided by CryptoTailor and paste it into the alert settings on TradingView. This ensures that every FVG signal is sent directly to your trading bot.
Testing and Optimizing the Automation Setup
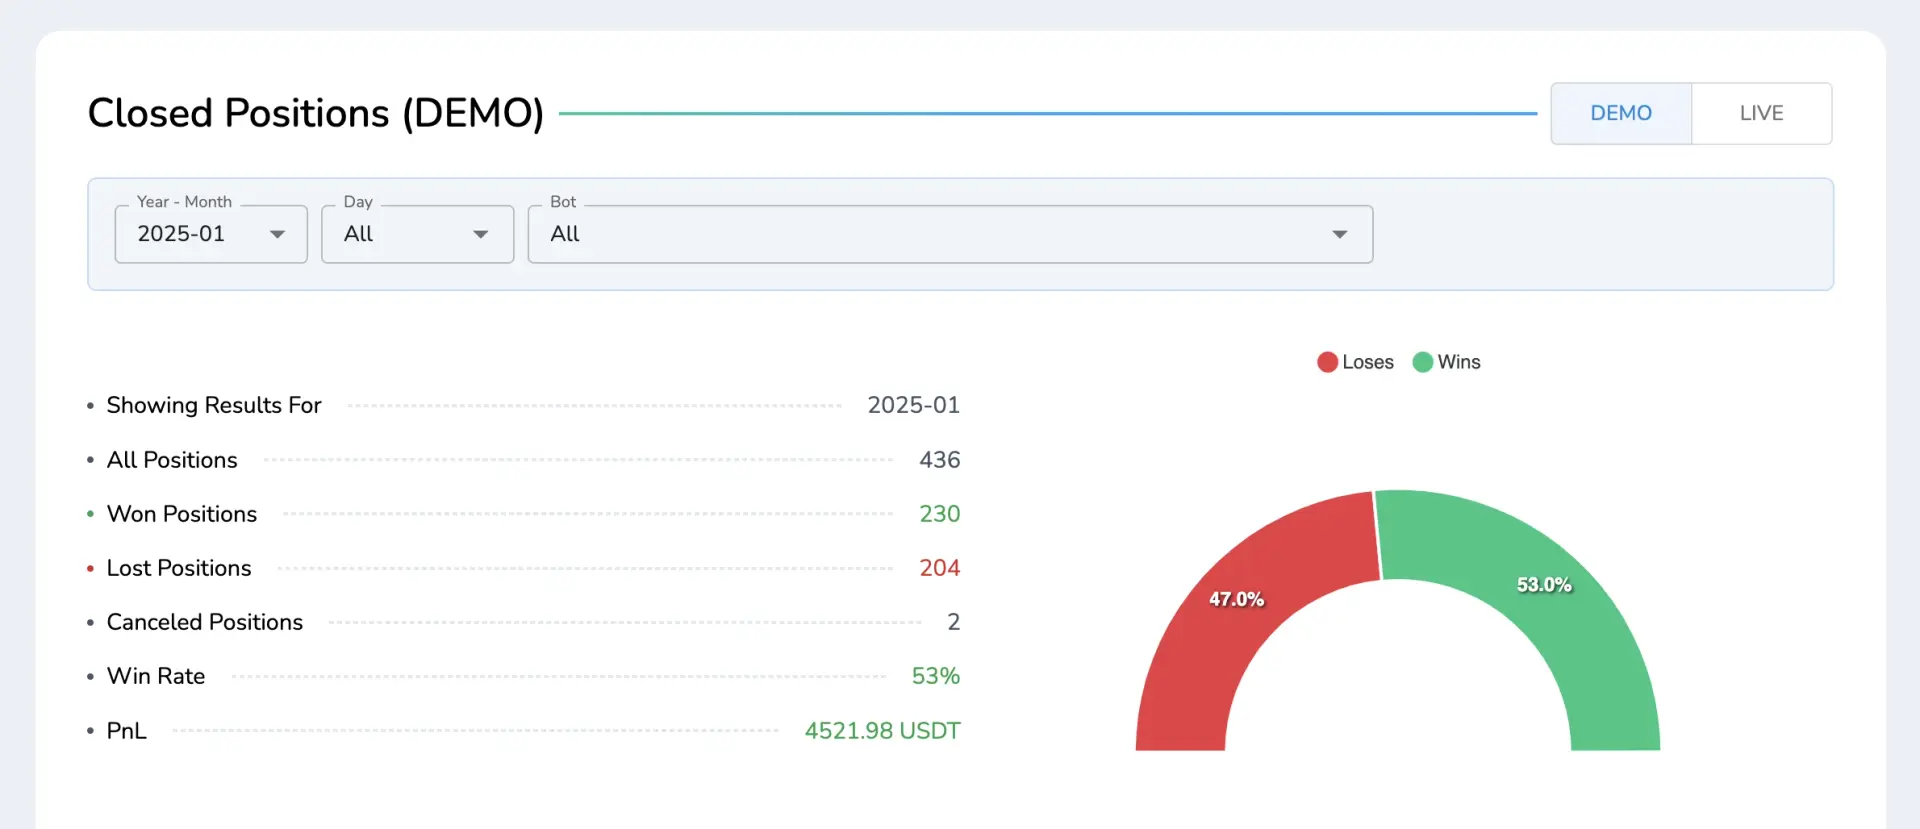
Before using real money, it’s important to test your automated FVG trading strategy in demo mode to evaluate its performance and make adjustments as needed. CryptoTailor Signal Bots allow you to execute trades in demo mode, where virtual money is used instead of real funds. This is an excellent way to forward-test your strategy in live market conditions without risking capital.
Analyze Performance Reports
- Win rate and loss rate
- Average risk-to-reward ratio
- Maximum drawdown
- Profitability over time
Transition to Live Trading
Once you’re confident in your strategy’s performance in demo mode, transition to live trading with real money. Start with smaller position sizes and gradually increase risk as you gain confidence in the system.
By combining the “Fair Value Gap [LuxAlgo]” indicator with CryptoTailor Signal Bots, you can automate your trading strategy with precision and confidence. This setup not only frees up your time but also ensures consistent execution and effective risk management, whether you’re forward-testing in demo mode or trading with real capital.