
The Aroon Indicator is a powerful tool for traders looking to gauge the strength and direction of a trend. Created by Tushar Chande in 1995, the Aroon Indicator is designed to identify new trends and determine whether an existing trend is likely to continue or reverse. In the fast-paced world of cryptocurrency trading, where trends can shift rapidly, the Aroon Indicator’s ability to provide early signals makes it an essential part of any trader's toolkit. In this post, we’ll explore how the Aroon Indicator works, how to interpret its signals, and how it can be applied in backtesting crypto strategies and automating trades using bots.
What is the Aroon Indicator?
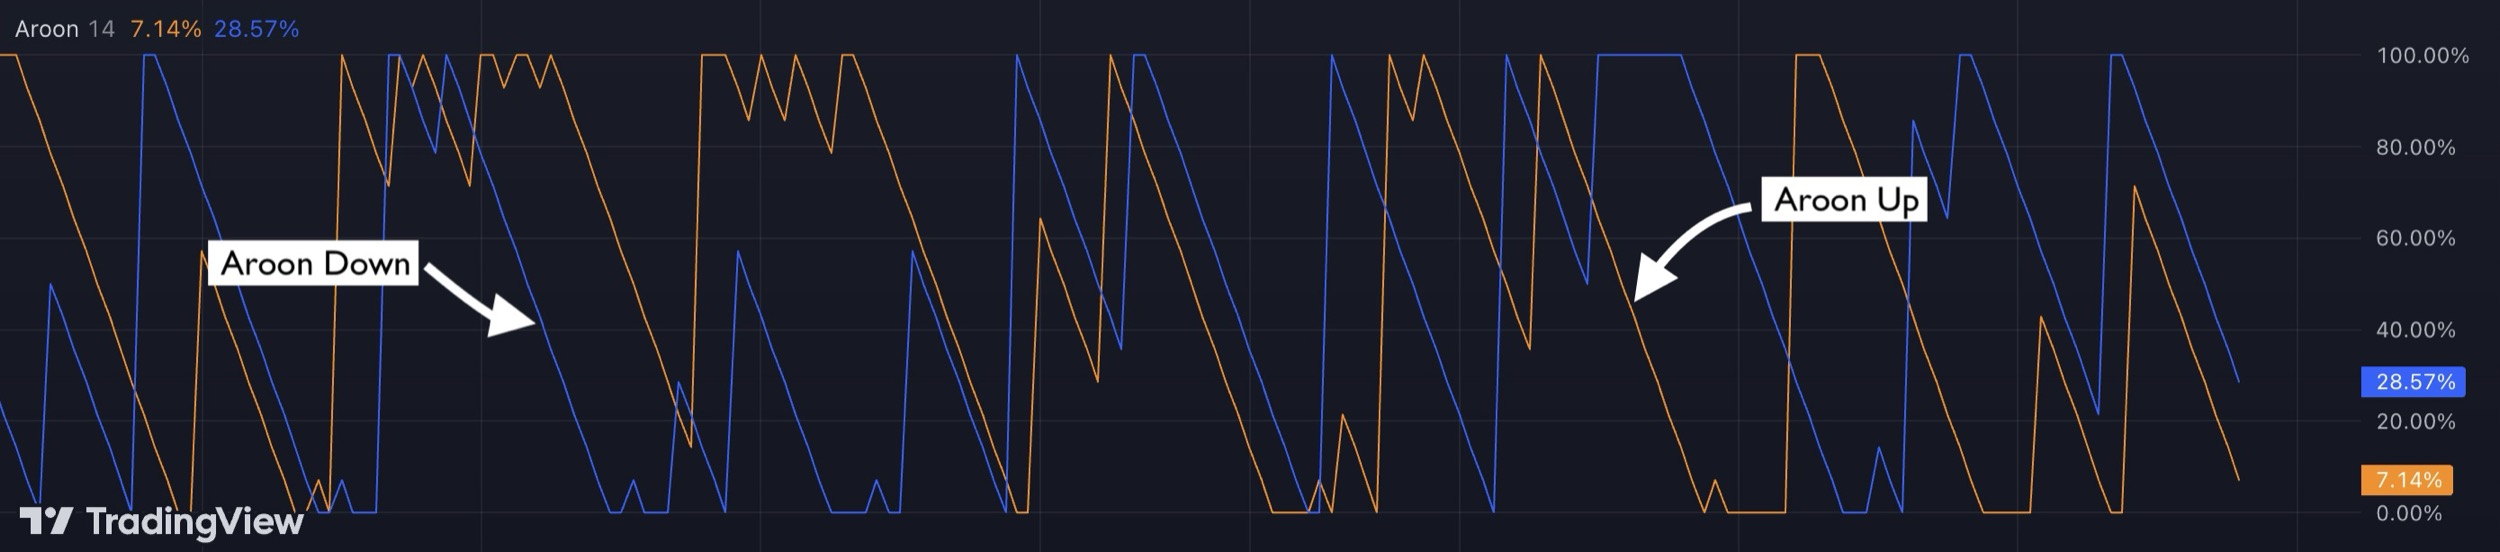
The Aroon Indicator is a trend-following tool developed by Tushar Chande in 1995, specifically designed to help traders identify the start of a new trend, spot the continuation of an existing trend, or detect a potential reversal. The Aroon Indicator consists of two lines—Aroon Up and Aroon Down—that track how long it’s been since a recent high or low was observed within a selected period (e.g., 14 days or 14 hours). By focusing on recent highs and lows, the Aroon Indicator gives traders a clear view of whether an asset is trending up, trending down, or moving sideways.
How Does the Aroon Indicator Work?
The Aroon Indicator works by calculating two main values:
- Aroon Up: This value is high (close to 100) when a recent high was reached within the period, indicating strong bullish momentum.
- Aroon Down: This value is high (close to 100) when a recent low was reached, showing strong bearish momentum.
These two lines move between 0 and 100, reflecting the proximity of recent highs or lows. When Aroon Up stays high and Aroon Down remains low, it’s a signal of a strong uptrend. Conversely, when Aroon Down is high and Aroon Up is low, it points to a strong downtrend. The indicator is particularly useful in helping traders avoid low-momentum periods and focus on trends with clear directional strength.
Interpreting the Aroon Indicator Signals
The Aroon Indicator can provide several useful signals for traders looking to identify trends or potential reversals:
Crossovers
A bullish signal occurs when Aroon Up crosses above Aroon Down, suggesting a shift towards an uptrend. A bearish signal occurs when Aroon Down crosses above Aroon Up, indicating a potential downtrend.
Readings Above 70 or Below 30
When Aroon Up remains above 70 for an extended period, it signals a strong uptrend. Conversely, an Aroon Down value above 70 indicates a strong downtrend. Values below 30 for either line indicate a lack of trend strength or potential market consolidation.
Parallel Movement
If both Aroon Up and Aroon Down are below 50 and moving in parallel, it often indicates a sideways or weak market, suggesting traders should avoid trend-following strategies until a clearer trend emerges.
By understanding these signals, traders can effectively time their entries and exits based on the market’s momentum and avoid periods of low volatility.
Using the Aroon Indicator in Crypto Trading
- Trend Identification: The Aroon Indicator’s core strength is in identifying trends early. In the cryptocurrency market, where prices can be volatile, the Aroon Indicator helps traders confirm trend strength before making decisions, reducing the risk of entering trades based on short-term fluctuations.
- Detecting Reversals: Crossovers between Aroon Up and Aroon Down can indicate potential trend reversals. For instance, when Aroon Down crosses above Aroon Up, it may signal a shift towards bearish momentum, allowing traders to prepare for possible declines or set up sell orders in advance.
- Sideways Market Detection: Aroon values consistently below 50 for both lines can signal a consolidation phase. During this time, the market lacks a clear direction, making it less suitable for trend-following strategies. Recognizing these phases can help traders avoid whipsaw trades and preserve capital for more favorable setups.
Combining the Aroon Indicator with Other Indicators
To increase the reliability of the Aroon Indicator signals, it can be used alongside other indicators for confirmation:
- Moving Averages: A longer-term moving average can confirm the trend identified by the Aroon Indicator. For example, if Aroon Up crosses above Aroon Down while the price is above the 50-period moving average, it adds confidence to a bullish setup.
- Relative Strength Index (RSI): Combining Aroon with RSI helps confirm trend strength or overbought/oversold conditions. If Aroon Up is above 70 and RSI is also above 50, it strengthens the case for an uptrend.
- Volume Indicators: High volume during an Aroon crossover can indicate that the trend reversal has strong backing, reducing the likelihood of false signals. Using indicators like On-Balance Volume (OBV) alongside Aroon can help validate significant moves.
Practical Applications of the Aroon Indicator in Crypto Trading
The Aroon Indicator offers unique insights for crypto traders, particularly in the high-volatility environment of cryptocurrencies. Because crypto markets are often unpredictable, spotting reliable trends and staying clear of low-momentum periods can make a huge difference in profitability. The Aroon Indicator helps traders zero in on moments when trends are developing or losing steam, enabling better timing for entry and exit points.
For instance, when Aroon Up is consistently high and Aroon Down remains low, this suggests a stable uptrend, ideal for entering long positions. Conversely, if Aroon Down is high and Aroon Up is low, it may be a good time to exit or consider shorting. In sideways or consolidating markets, where both lines are below 50, traders might decide to stay out or switch to range-trading strategies. Using Aroon with crypto-specific knowledge—such as understanding how certain coins react to market news or events—can further enhance trading outcomes.
Advantages and Limitations of the Aroon Indicator
Advantages:
- Simplicity: The Aroon Indicator is easy to understand and interpret, making it accessible to both beginner and experienced traders.
- Effective for Trend Identification: Aroon’s ability to identify trends early and detect reversals is valuable in fast-moving markets like crypto.
- Adaptable to Multiple Time Periods: The Aroon Indicator can be used across different periods, from short intraday to longer weekly charts, making it versatile for various trading styles.
Limitations:
- Less Effective in Sideways Markets: Aroon can produce false signals in low-volatility or range-bound markets, as it is primarily a trend-following indicator.
- Lagging Nature: Like most indicators, Aroon may lag behind price action, causing signals to appear after a trend has already begun. Combining it with leading indicators can help improve timing.